Advanced business analytics service provider SAS has announced that it created an entire suite of business intelligence, data management and analytics applications for any industry.
 According to the company, there was a time when data and business analytics were just fancy words. Now they are essential in just about every industry, big and small. Companies are now investing heavily on using data for business expansion, continuity and sustainability. They are integrating business intelligence and analytics into the core of their operations.
For instance, health companies have begun using predictive analysis for patient management. Banks and insurance firms also want client data that would help them deliver certain services. Retail companies are also using customer behavior analysis to draw better marketing campaigns for specified product offers. In the utility services sector, power and water companies are monitoring electricity usage in homes and businesses. Telecommunications companies are tailor-fitting services based on customers’ use of data, voice and SMS services.
As these companies grow, so too their needs to manage the scale of the data they are using. In recent years, IT managers have begun acknowledging the concept of “big data.” It has come in different iterations in the past but because of a variety of factors, big data’s value as a competitive business advantage made it all the more important.
“Big data,” as the name implies, refer to information, be it analog or digital, that is collected by a company. This information, when organized, can provide an overview of company performance, customer behavior, and even predictive data. This crucial information can result in sound business decisions and better customer services.
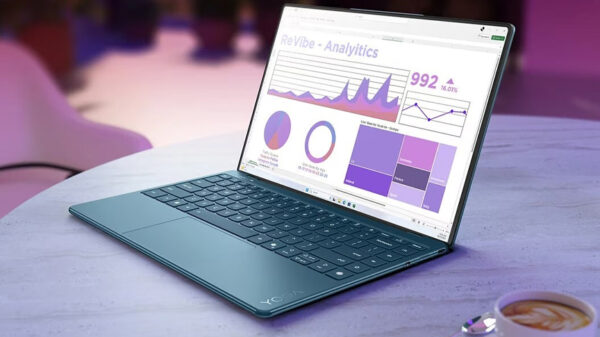
Particularly launched was SAS Visual Analytics, which is built with automated analytics that allows users with limited technical skills to manage data conveniently. Its In-Memory processing provides immediate access to data insights and reports, to aid executives in their decisions. Users can also share data through the web and mobile devices, and sift through Twitter streams, customer comments in call logs, and various text data to get quick insights on the day’s “hot topics.”
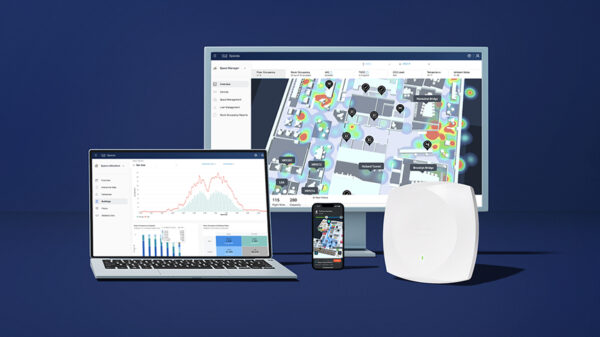
Christine Dizon, information management practice lead for SAS Philippines, says that SAS Visual Analytics suite was created specifically for scalable data management for effective business intelligence. It supports fast querying and reporting of massive data kept in memory. SAS Visual Analytics provide fast calculations and presents the needed output in an easy-to-read visualized interface on a simple yet intuitive dashboard.
“Users wanting immediate calculations can just drag-and-drop filters, and fine-tune data sets with sliders and check boxes. They will see instant representations of their data as charts, graphs, and histograms, and maps. Seeing your data like these will impact your company’s decision making capabilities, especially now that more data can be mined,” Dizon ended.


